Welcome to the Projects Page


Go to GitHub to see the code

GitHub

Group Projects


Generic placeholder image

Terrorism Trends

Data on the rise of national political parties in Europe was cross referenced with data on the occurrence of terrorism in Europe to see if there was a correlation between the two. Co-Coded the python, and research terrorism counts for country by using international terrorism guidelines. Used NYTimes and BBC API to search count of terrorism activities/trends in Europe by keyword. Analyzed vote outcomes by country to determine the percent increase of the populist party. Python, API, Jupyter Notebook, PowerPoint

See the code on GitHub »

Terrorism Trends Site »

Generic placeholder image

Beatport Webscraping

The EDM top 100 chart was web-scraped from beatport.com and the data was visualized using line graphs. Wrote the HTML, CSS, Co-Coded python, Flask, and Javascript. We used Python with BeautifulSoup, HTML, CSS, Flask, Plotly.js, Jupyter Notebook, Visual Studio Code, Power Point

See the code on GitHub »

Generic placeholder image

Senator Tweet

For this project we grabbed over 290,000 tweets from US senators to see the rate of positive, negative and neutral tweets (using machine learning). We also had the machine learning program predict which political party the senator belongs to based off the tweet alone. Co-Coded python for API, visualization using Tableau Python, Tableau, Jupyter Notebook

See the code on GitHub »

Senator Tweet Site »


Individual Projects


Generic placeholder image

Belly Button Biodiversity

I built an interactive dashboard to explore the Belly Button Biodiversity DataSet.

See the code on GitHub »

Belly Button Biodiversity Site »

Belly Button Biodiversity DataSet »

Generic placeholder image

Heroes of Pymoli

For this project I had to pretend that I worked for an online MMORP Game called Heroes of Pymoli and had to run reports based on player count, purchasing analysis (total), gender demographics, purchasing analysis (gender), age demographics, top spenders, most popular items, and most profitable items. Click to links to see more.

See the code on GitHub »

Direct link to code in GitHub »

Generic placeholder image

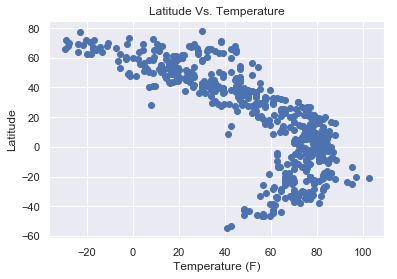
Latitude Weather Analysis

This project utilizes Python, API’s, and JSON to try and answer a fundamental question: “What’s the weather like as we get closer to the equator?”

See the code on GitHub for the weather API »

The Project as a webpage »